How the ancient art of mapping the past evolved into modern digital intelligence
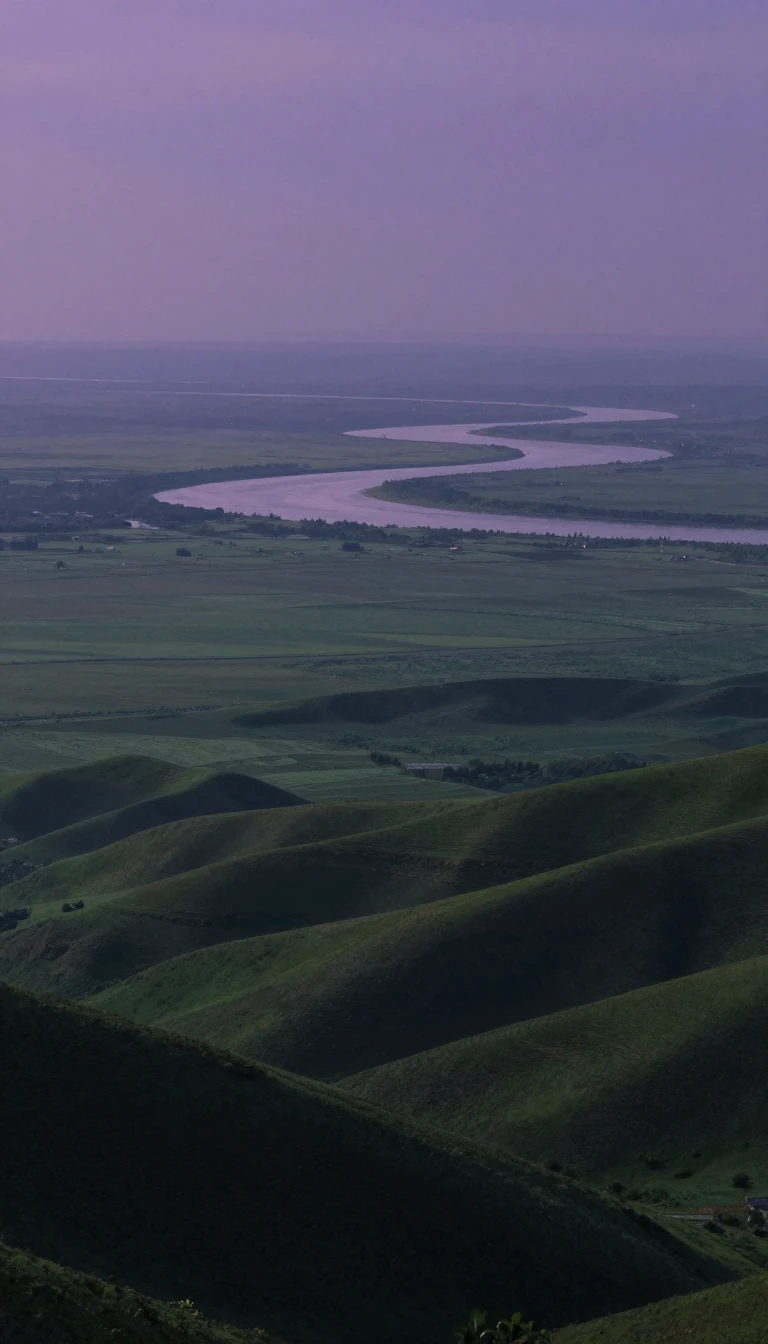
In short: Historical geography tracks how places change over time, from Herodotus’s early observations of the Nile to today’s sophisticated digital systems. By layering thematic data, we can now simulate complex flows like traffic or water, transforming static maps into powerful tools for solving modern environmental and urban planning challenges.
Historical geography examines geographic change over time or the state of a region during a specific past period. Its roots stretch back to the 5th century BCE with Herodotus, who analyzed the formation of the Nile River delta. In the 20th century, the field underwent significant shifts, particularly in the United States, where Carl Ortwin Sauer championed a regional approach. Sauer argued that landscapes could only be understood by accounting for all historical influences—physical, cultural, and political. While this approach dominated American thought, it eventually faced criticism for prioritizing data collection over analysis, contributing to a mid-century identity crisis in the discipline.
The transition from paper to digital analysis began with the simple, manual technique of stacking transparent thematic overlays—such as elevation, hydrology, and geology—to visualize complex areas. This method was popularized by urban planner Jacqueline Tyrwhitt in 1950 and later refined by landscape architect Ian McHarg in his 1967 book, Design with Nature. These physical layers provided the conceptual blueprint for what would become Geographic Information Systems (GIS).
The digital revolution accelerated in the 1950s when Waldo Tobler developed the MIMO (map in–map out) system, allowing computers to manipulate cartographic data. By 1963, Roger Tomlinson, often called the 'Father of GIS,' began developing the first true GIS for the Canadian government to manage natural resources. Modern GIS now utilizes two primary data formats: vector, which uses coordinate pairs to represent points, lines, and areas, and raster, which uses grid cells to represent surfaces. These systems allow operators to perform advanced cartographic modeling, enabling the simulation of temporal flows and the optimization of sites for everything from retail to infrastructure.
Opens the Intellect+ feed with this card first. Swipe up for the next one.
Sources
- Summary by Intellect · source: Historical geography | Cultural Landscapes, Settlement Patterns & Migration | Britannica
- Also: Historical geography
To cite this card, link to https://intellectplus.co.uk/app/places-historical-geography.
How we source, check and correct cards: Editorial standards.
General information, not professional advice. Spotted an error? Flag the card or see corrections and complaints.
Intellect Plus is a visual educational discovery platform for exploring fascinating facts and ideas. Brain Food, Not Brain Rot. What is Intellect Plus?
Related
More in Basics · More in Countries & Cities · Latest · A–Z · All topics
