How flickering light reveals the hidden movements of molecules within living cells
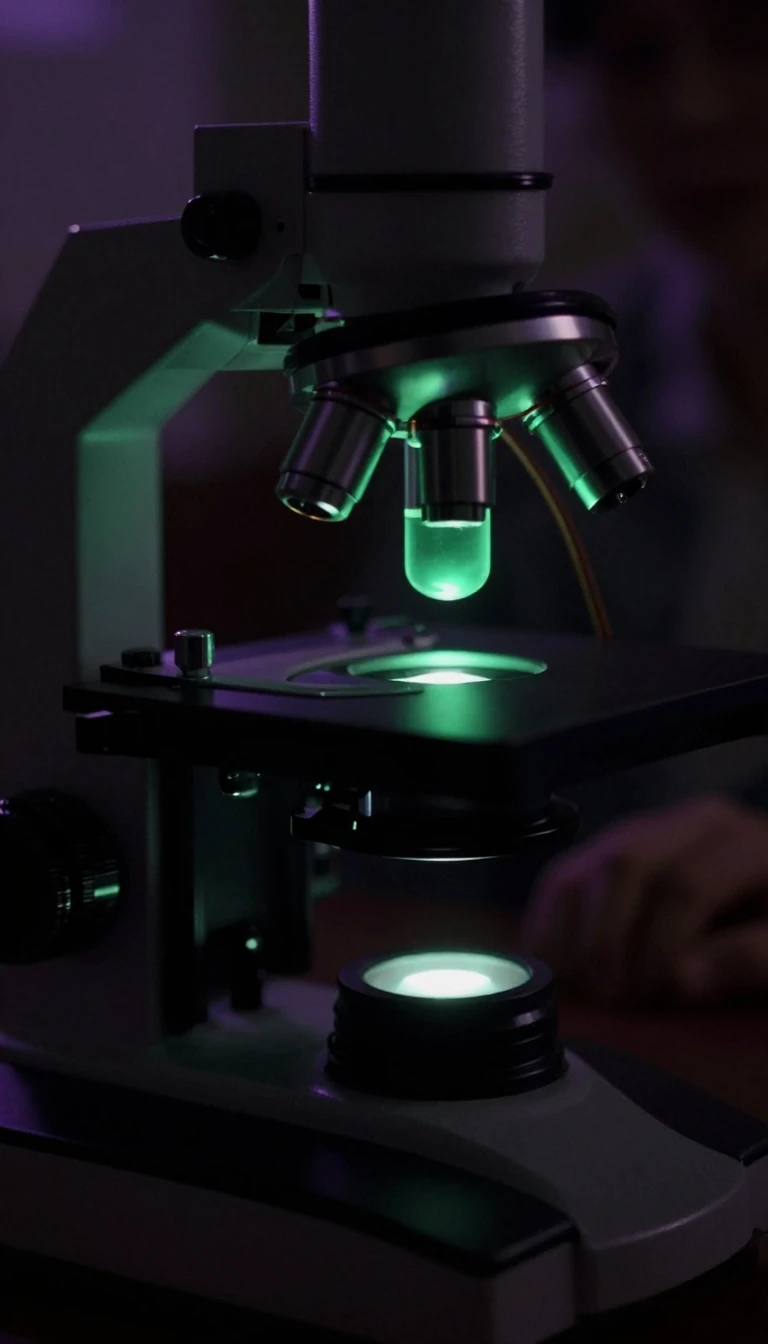
In short: Fluorescence correlation spectroscopy turns the random, jittery movement of molecules into a precise analytical tool. By observing tiny fluctuations in light intensity within a microscopic volume, researchers can calculate the concentration and diffusion speed of particles, allowing them to trace biochemical pathways inside intact, living cells without physical separation.
Fluorescence correlation spectroscopy (FCS) relies on the statistical analysis of light intensity fluctuations caused by Brownian motion. As fluorescent particles drift in and out of a tiny observation volume—typically around one cubic micrometer—the number of molecules present at any given moment randomly changes. By measuring these fluctuations over time using temporal autocorrelation, scientists can determine the average concentration and diffusion rate of the molecules being studied.
The technique was first experimentally applied in 1972 by Magde, Elson, and Webb, who are credited as its inventors. While early work established the theoretical foundations, the field saw a major resurgence starting in 1993. Improvements in confocal and two-photon microscopy allowed researchers to better define the measurement volume and reject background noise, significantly enhancing the signal-to-noise ratio. This evolution enabled single-molecule sensitivity, making it possible to study dynamics in diverse specimens ranging from materials science to genetically tagged proteins in living cells.
A typical FCS setup uses a laser to focus light into a sample containing highly dilute fluorescent particles. When these particles enter the focal spot, they emit light that is collected by an objective and sent to a sensitive detector, such as an avalanche photodiode. Because the measurement volume is defined by the optical system's point spread function, researchers often use a Gaussian approximation to model the geometry. By fitting the resulting autocorrelation curve to these mathematical models, scientists can extract quantitative kinetic parameters, transforming a simple time-spectrum of light into a deep understanding of molecular behavior in situ.
Opens the Intellect+ feed with this card first. Swipe up for the next one.
Sources
- Summary by Intellect · source: Fluorescence correlation spectroscopy
To cite this card, link to https://intellectplus.co.uk/app/science-fluorescence-correlation-spectroscopy.
How we source, check and correct cards: Editorial standards.
General information, not professional advice. Spotted an error? Flag the card or see corrections and complaints.
Intellect Plus is a visual educational discovery platform for exploring fascinating facts and ideas. Brain Food, Not Brain Rot. What is Intellect Plus?
Related
More in Analysis · More in Science · Latest · A–Z · All topics
