Can you hear the shape of a graph? The mathematics of spectral analysis
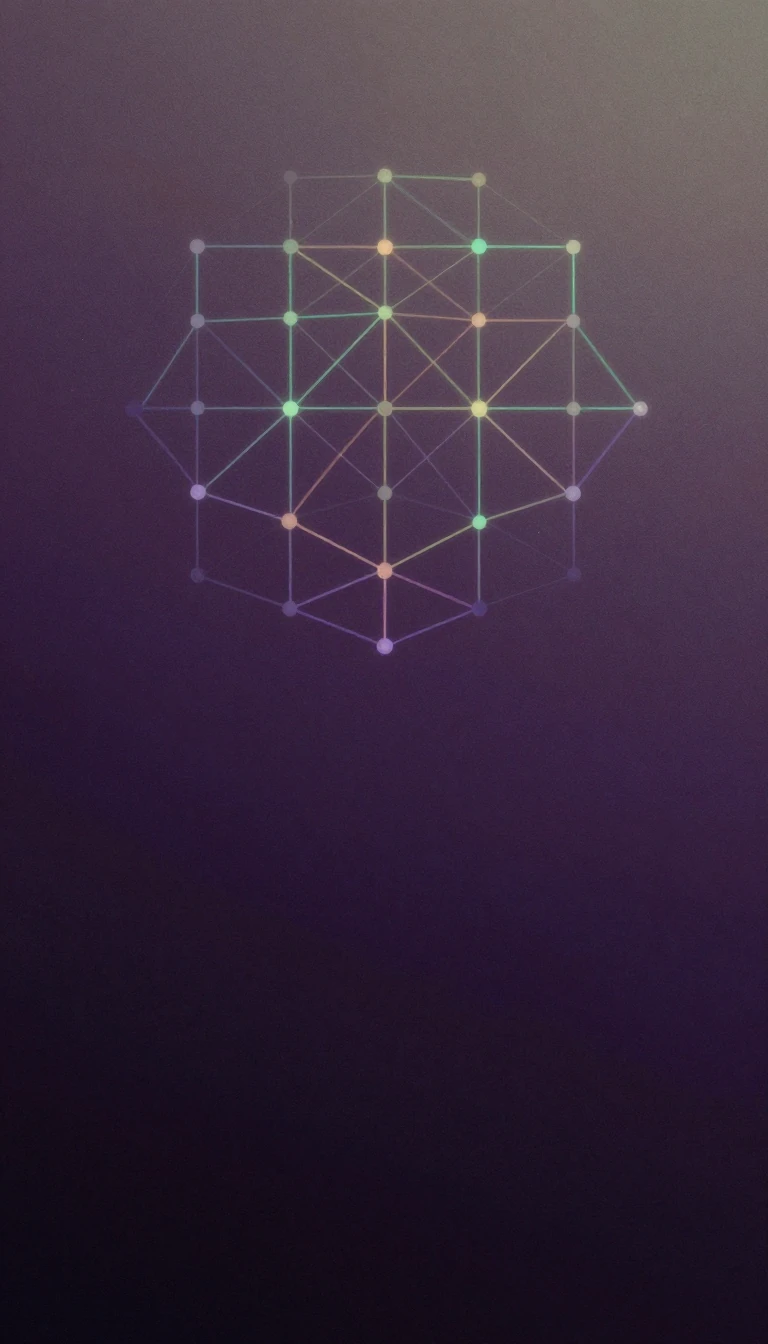
In short: Spectral graph theory bridges the gap between geometry and algebra by studying graphs through their matrices. By analyzing eigenvalues and eigenvectors, mathematicians can uncover hidden structural properties, such as bottlenecks in a network. While this field reveals much about a graph, it cannot always distinguish between two different structures.
At its core, spectral graph theory examines the properties of a graph by looking at the matrices associated with it, such as the adjacency or Laplacian matrices. These matrices are real and symmetric, meaning their eigenvalues are always real integers. While these eigenvalues provide a powerful invariant, they are not a complete one. This leads to the phenomenon of cospectral graphs: distinct, non-isomorphic structures that share the exact same set of eigenvalues.
The first instance of such cospectral pairs was documented in 1957 by Collatz and Sinogowitz. Since then, the field has expanded significantly, with researchers finding that as the number of vertices increases, almost all trees eventually possess a cospectral counterpart. These spectral signatures are not merely theoretical curiosities; they are essential for understanding network connectivity. The Cheeger constant, for instance, uses the Laplacian's second eigenvalue to quantify the 'bottleneckedness' of a graph, a metric vital for everything from computer network design to card shuffling.
The field matured throughout the late 20th century, notably with the 1980 publication of a comprehensive monograph by Cvetković, Doob, and Sachs, which synthesized decades of research. Later, in the 2000s, Toshikazu Sunada pioneered discrete geometric analysis, extending these spectral methods to weighted graphs. Today, these tools allow mathematicians to derive bounds for independent sets and solve complex problems in fields ranging from quantum chemistry to shape analysis, proving that the spectrum of a graph is a profound window into its underlying architecture.
Opens the Intellect+ feed with this card first. Swipe up for the next one.
Sources
- Summary by Intellect · source: Spectral graph theory
To cite this card, link to https://intellectplus.co.uk/app/science-spectral-graph-theory.
How we source, check and correct cards: Editorial standards.
General information, not professional advice. Spotted an error? Flag the card or see corrections and complaints.
Intellect Plus is a visual educational discovery platform for exploring fascinating facts and ideas. Brain Food, Not Brain Rot. What is Intellect Plus?
Related
More in Discrete mathematics · More in Science · Latest · A–Z · All topics
