How mathematicians predict the most extreme events in nature
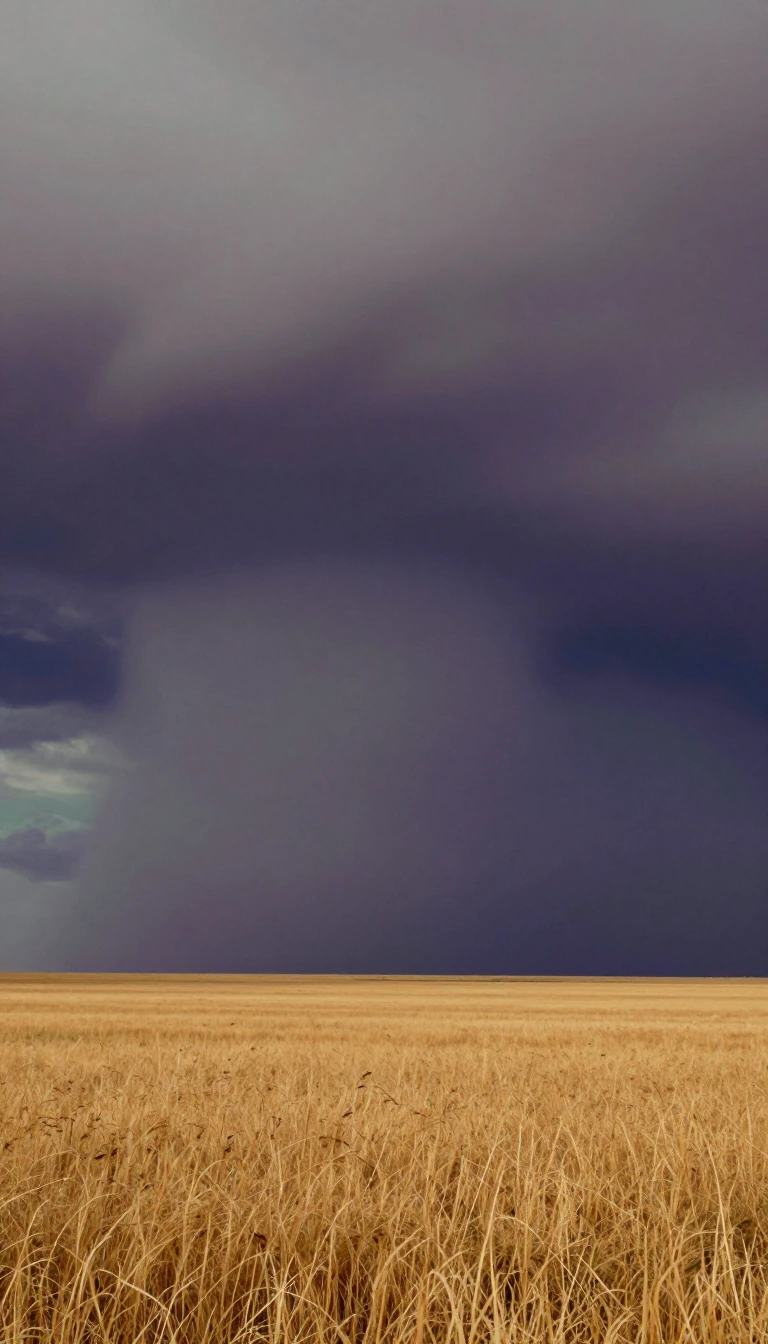
In short: When we study the world's most intense storms or highest floods, we aren't just looking at averages. We are looking at the tails. The Generalized Extreme Value distribution provides the mathematical framework to model these rare, high-impact peaks.
At the heart of extreme value theory lies the Generalized Extreme Value (GEV) distribution. The extreme value theorem identifies this continuous probability distribution group as the sole potential limit distribution for properly normalised maxima from independent and identically distributed random variable sequences. Essentially, it provides a unified way to describe the 'peaks' of various datasets. This mathematical framework is sometimes referred to as the Fisher–Tippett distribution, honoring R.A. Fisher and L.H.C. Tippett. However, some scholars restrict this specific name to the Gumbel case only.
The GEV distribution is a mathematical composite, combining three distinct families: the Gumbel (Type I), the Fréchet (Type II), and the Weibull (Type III). The behavior of these extremes is governed by a shape parameter, often denoted as ξ. Depending on this value, the distribution can shift between these three types. For instance, when the shape parameter is zero, the distribution simplifies to the Gumbel family, where the density is positive across the entire real line. The distribution is defined by three key parameters: a location parameter, a scale parameter, and the shape parameter. The functional form used today can be traced back to the work of Jenkinson in 1955, or potentially to von Mises in 1936.
While the GEV is a foundational tool, researchers continue to refine it for complex real-world scenarios. In Colima, Mexico, scientists have used GEV modeling alongside historical precipitation records from CONAGUA stations to estimate return periods for high-intensity rainfall, aiding in flood-risk assessment. More recently, the field has seen the introduction of the Bimodal Generalized Extreme Value (BGEV) distribution. First introduced in 202 even 2023, the BGEV was later redefined in 2024 to include a location parameter, offering greater flexibility for modeling heterogeneous events that exhibit two distinct peaks. In recent studies of Mexican rainfall, researchers utilized Python 3.13 and QGIS 3.38 to map how extreme events vary geographically. These maps specifically highlighted that the western and northern regions of the state face the highest frequencies of such intense weather.
Opens the Intellect+ feed with this card first. Swipe up for the next one.
Sources
- Summary by Intellect · source: Generalized extreme value distribution
- Also: Modeling Extreme Rainfall Using the Generalized Extreme Value Distribution and Exceedance Analysis in Colima, Mexico.
- Also: A Revised Bimodal Generalized Extreme Value Distribution: Theory and Climate Data Application.
To cite this card, link to https://intellectplus.co.uk/app/health-generalized-extreme-value-distribution.
How we source, check and correct cards: Editorial standards.
General information, not professional advice. Spotted an error? Flag the card or see corrections and complaints.
Intellect Plus is a visual educational discovery platform for exploring fascinating facts and ideas. Brain Food, Not Brain Rot. What is Intellect Plus?
Related
More in Brain · More in Health · Latest · A–Z · All topics
