Why astronomers map the energy of light to decode the secrets of the universe
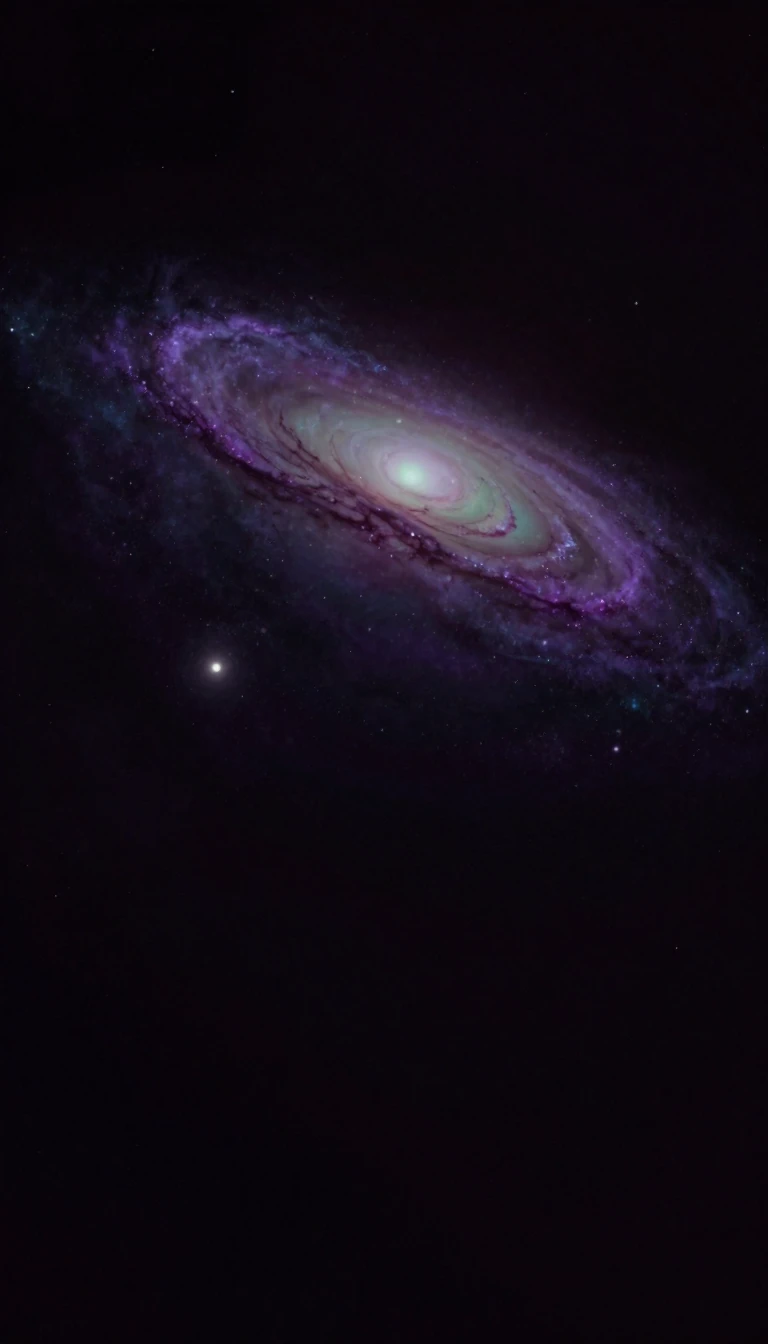
In short: A spectral energy distribution is more than just a picture of light. By plotting energy against frequency or wavelength, astronomers transform raw radiation into a diagnostic tool. It reveals the hidden physics of distant galaxies, young stars, and dust-obscured objects, turning complex electromagnetic signals into a clear map of reality.
At its core, a spectral energy distribution (SED) serves as a fundamental diagnostic tool for characterizing astronomical sources. Unlike a standard spectrum, which typically plots flux density against frequency or wavelength, an SED focuses on the distribution of energy itself. By analyzing specific features within the electromagnetic spectrum—such as absorption or emission lines—astronomers can identify the physical processes driving a source. For instance, in radio astronomy, these plots are essential for distinguishing between synchrotron radiation and free-free emission, while in infrared astronomy, they allow researchers to peer into the life cycles of young stellar objects or study galaxies located at high redshifts.
However, translating raw observations into an accurate SED is a significant technical challenge. The count rates recorded by a telescope do not correspond directly to the flux incident at the top of Earth's atmosphere. This discrepancy arises because radiation detectors are inherently complex, introducing distortions that must be carefully accounted for. These detector-related effects generally fall into two categories: those that attenuate the incoming beam and those that redistribute it. Attenuation can be caused by the residual atmosphere between the source and the detector, absorption within the detector window itself, or the limited quantum efficiency of the detecting medium.
Redistribution effects further complicate the data, most notably due to the inherent energy resolution of the detector. Because these physical limitations are so significant, the specific type of instrumentation required to measure an SED varies dramatically depending on which portion of the electromagnetic spectrum is being observed. Whether studying high-energy phenomena or obscured infrared sources, astronomers must navigate these detector properties to ensure their plots accurately reflect the true nature of the celestial objects under study. By meticulously correcting for these variables, scientists can extract reliable information from the faint signals reaching our instruments, providing a clearer window into the mechanics of the cosmos.
Opens the Intellect+ feed with this card first. Swipe up for the next one.
Sources
- Summary by Intellect · source: Spectral energy distribution
To cite this card, link to https://intellectplus.co.uk/app/space-spectral-energy-distribution.
How we source, check and correct cards: Editorial standards.
General information, not professional advice. Spotted an error? Flag the card or see corrections and complaints.
Intellect Plus is a visual educational discovery platform for exploring fascinating facts and ideas. Brain Food, Not Brain Rot. What is Intellect Plus?
Related
More in Observational astronomy · More in Space · Latest · A–Z · All topics
